Real time twitter data visualization with Processing.js
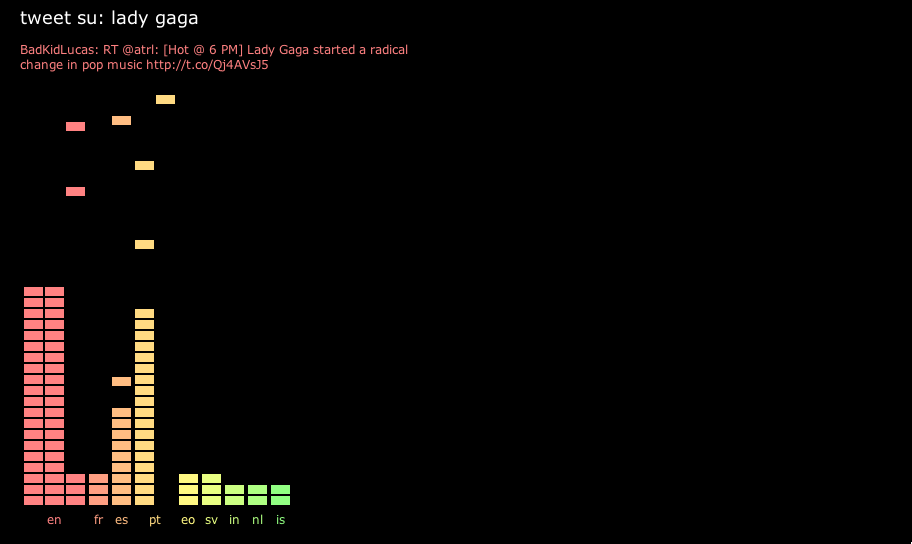
Lately I’ve been pretty busy enjoying some real time data visualization examples and demo. To have some data to work with I decided to use Twitter API, in particular I rely on jQuery LiveTwitter plugin by elektronaut; next I built a stack chart like visualization in which every new tweet of a chosen topic is dropped over its language column.
To create the view I used Processing.js, which is very easy and simple to work with. Here’s a screenshot of the completed application:

The application is also featured in Processing.js exhibition page and a guide (in italian) is undergoing with all the technical details about its implementation.
Tags: data visualization, Processing, real time, twitter